Next Stop for Gold Is $2,100 Not $1,300 By Jordan Roy-Byrne/Trendsman Thursday,
2 July 2009
Practically
everyone in the gold community has mentioned the inverse head
and shoulders pattern on the gold chart and the corresponding
$1,300 target. The target is correct but the interpretation
of the pattern is not entirely correct. That target comes
from the pattern being a reversal pattern but in the current
case of Gold it is not a reversal pattern. There is no downtrend
it is reversing from. However, the pattern can actually function
as a continuation pattern as John Murphy explains in his book,
Technical Analysis of the Financial Markets:
“In the previous chapter, we treated the
head and shoulders pattern at some length and described it
as the best known and most trustworthy of all reversal patterns.
The head and shoulders pattern can sometimes appear as a continuation
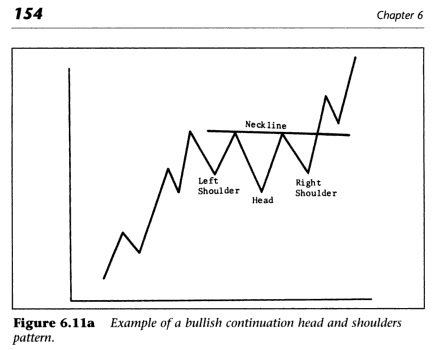
instead of reversal pattern. In the continuation head and
shoulders variety, prices trace out a pattern except that
the middle trough in an uptrend tends to be lower than either
of the two shoulders.”
Below is a picture from the book:
The pattern is a continuation
pattern because it ensures the continuation of the prior trend.
Continuation patterns themselves don’t produce price targets.
In a continuation pattern like a flag or pennant, you usually
take the length of the preceding move and add it to the top
of the flag/pennant to get a price target. Point being, it’s
possible for $1,300 to be a target but it’s not the level
that we should be focusing on.
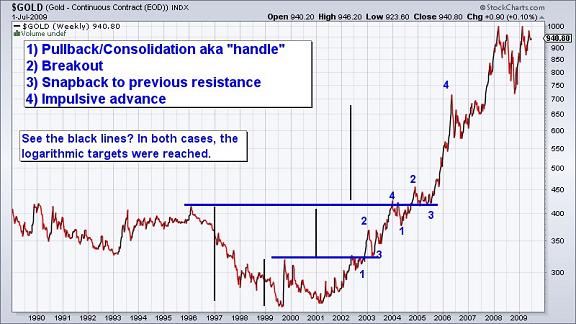
Cup and Handle Pattern
Gold has formed sort of a cup and handle
pattern more than a few times. The first example is from 1999
to 2003 and the second example is from 1996 to 2004. Please
note the four steps of the pattern that occurred in both cases.
The pattern can have a simple target and a logarithmic target.
I find that the logarithmic target is achieved in the long-term
patterns. The target is calculated by taking the percent distance
from the bottom of the cup to the top and then adding it to
the top. (Example- 200 to 400 is 100%, so the target is 800).
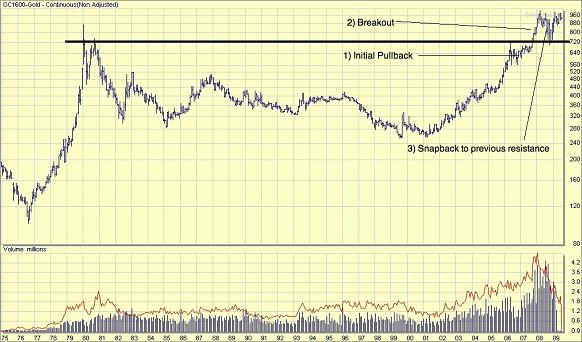
Far more important than the inverse head and
shoulders, is this mega long-term cup and handle pattern.
It has completed the three steps and a move above $1,000/oz
would confirm that the 4th step (impulsive advance) is underway.
Using $730 and a low of $255, I calculate a logarithmic price
target of $2,089. In the previous two patterns, which evolved
over eight years and four years, it took less than a year
in both cases for the target to be reached (following the
third step).
At present Gold is struggling between $920
and $940. There is better than a 50-50 chance that the US
Dollar rebounds, which would likely send Gold to support at
$880.
If you are interested in more detailed and
thorough analysis of Gold, Silver, the Dollar, and numerous
gold/silver stocks, then you can click the link below to find
out all the details about our new newsletter. We specialize
in tracking the technicals and sentiment (short term options
data and short interest) on 40 gold/silver stocks.