How
do rare U.S. coins stack up as investment?
By David L. Ganz| Numismatic
News
August 7, 2007
When I first started writing
about coins professionally in 1965, the Dow
Jones Industrial Average topped out the year
at 911 on its way to 792 the following year.
Corporate bonds paid out an average of 4.49
percent according to Moody's, which quoted
the rate for corporate Aaa bonds.
Treasury bills (government
obligations of more than a month in duration)
were averaging about 3.93 percent, on their
way, thanks to the Vietnam War, to 4.76 percent
the following year, and the Standard &
Poor's 500 average was an odd-sounding.
Gold was priced at $35 an ounce officially,
and $35.15 on the free market that barely
existed, since Uncle Sam would gladly exchange
gold for dollars from anyone in the world
except its own citizens, who had all been
prohibited from owning gold (except for rare
and unusual coins) since 1933.
Silver was $1.2929 an ounce, a Rubicon of
sorts since above that price, melted silver
dollars bought at face value turned a profit
for the holder.
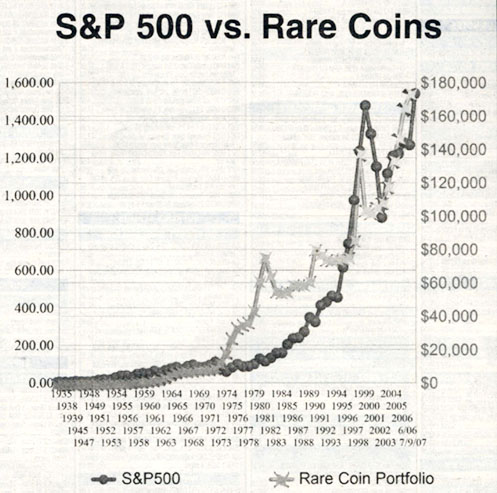
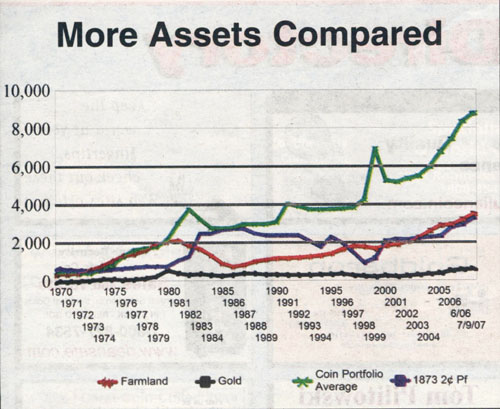
This graph compares the performance
ofthe S&P 500 stock index with that of the
rare coin market basket
Silver coin still
circulated, but barely, in 1965; by July, the Coinage
Act of 1965 ended silver in the dime and quarter and
moved toward a 40 percent silver half. By 1967, silver
ended the year above $1.55 though gold stayed at $35.
Platinum was a mere $98 an ounce (up 10.8 percent
from the previous year), and farmland in Iowa, according
to the U.S. Department of Agriculture and Iowa State
University, was selling at $318 an acre - up 9 percent
from the year before; over the succeeding 42 years
it would average advances of about 5.4 percent annually
(though obviously with some ups and downs).
Welcome to the American Numismatic Association convention
edition of the Salomon Brothers review of the corn
market, something that I've followed for more than
40 years, and written from the perspective of a collector
who also buys stocks and remembers when it made front
pages of the New York Times that the Dow had moved
downward by a mere 15 points in a single day.
As I'm writing this, the Dow has gone over 14,000
and then retreated some. My charting that accompanies
figures the Dow for what it was earlier in the summer
at 13,649. (It takes six to eight weeks to prepare
the data and then more time to do the graphing and
charts). Some of the other relevant numbers: farmland,
according to the chief professor who measures it at
Iowa State, is now going for $3,500 an acre ("or
more," he said in an e-mail interview in early
July).
Gold is figured at $661.50, up consistently since
2004; silver figures in the mix at $12.69, also a
steady price rise since 1999; platinum is figured
at $1,307 the ounce, also right up there since 2001.
The CPI is catching a little bit of inflation, averaging
about 3.43 percent annually, now at about 208 on the
1982=100 scale. OK, you want to know about where coins
stand in all this. First, a word about the portfolio
that has been averaging a 13.5 percent rate of change
since 1937 - and about 9.8 percent annually since
1965. (The Dow during the same period averaged about
7.5 percent using year-end numbers as a basis for
the average).
Both the Dow Jones and the index compilation for rare
coins utilized in this analysis use a market-basket
approach, measuring selected coins designed to represent
the whole marketplace, and selected stocks that are
broadly representative of the industrial sector of
the American economy.
Components of the Dow Jones have changed during the
period (though the results have not); the coins are
static because the index was initially compiled by
someone else and was discontinued 17 years ago. I
keep the flame alive with the original components
because it is such a good representative mix.
Dow Jones statistics are calculated daily, and based
on actual components and prices published in many
periodicals. The coin list was first compiled annually
by Salomon Brothers going back to 1978, and carried
through 1990. It was always done on an annualized
basis. That can lead to somewhat misleading results,
but still a useful analysis at a specific point in
time.
For the analysis that follows, the Salomon Brothers
raw data itself was not used; instead, both back and
forward pricing was independently examined. Coin grading
changes over the years are taken into account. The
coins, with the exception of a high-end circulated
early American copper, are either choice uncirculated
or proof (about MS-63 or Proof-63 on the numerical
grading scale); if higher grades were utilized, such
as MS-65, the results would be substantially higher.
In fact, Dennis Baker, whose NumisMedia has supplied
me with working data for the past six or seven years,
has also included MS-65 data so I can compare. It
is so off-the-chart as to make the comparisons ridiculous.
Besides, broad-based market purchases of MS-63 are
possible; by their nature, MS-65 versions of many
older rarities are either thinly traded or just not
widely available.
I said last year that a subsequent column might look
at that over the last couple of years; figure on that
to come one of these weeks. I still intend to do it
when I have some spare time, but regular readers of
this column know Kathy and I have been traveling.
Annual review of the rare coin market, contrasting
it with the rate of inflation, the price of gold and
other precious metals, and specific rare coins has
been done since the late 1970s when Salomon Brothers,
then a Wall Street powerhouse institution, did the
annual accounting and contrasted it with collectibles
and other tangible asset components across the board.
These included Chinese porcelain, stamps, farmland,
foreign exchange, vari¬ous precious metals, the
CPI and a variety of stock and bond devices. Some
of the other collectible components are not replicated
in my analysis because of the practical difficulty
in creating a database that is reliable over the extended
period of time or because they are simply areas that
I am not sufficiently familiar with.
For example, when Kathy and I traveled abroad, we
bought Chinese porcelain, but that hardly counts as
a basis of price comparison. I was able to find a
farmland index, but no luck, yet, for stamps or foreign
exchange in market basket form. I could use the Federal
Reserve Bank of St. Louis database, but not this time.
Mike Dufijj an Iowa State professor, took the time
'to provide me with good data on farmland value. I
guessed originally a 5 percent increase over last
year. He set me straight: "The bankers estimated
that our values went up 7 percent in just the first
quarter. I would think that we are probably about
10 percent up from the November estimate. That would
mean about $3,500. It could even be higher. Tilings
have slowed down a bit, but there is still a lot of
strength in the market. At a meeting I have I asked
the increase for the year and that group thought it
would be about 20 percent."
Internet research developments - not available widely
until the last couple of years - have made it possible
to use government and other statistics for farmland
value (based on average value per acre of American
farmland), corporate "Aaa" rated bonds and
other items.
This time, as in my January report, I retroactively
changed farmland to cover only that in Iowa because
the data seems more current, is reliable and accessible.
U.S. government statistics are sporadic and finalized
numbers are still two to three years old.
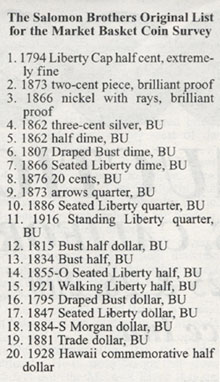
A total of 20 different individual coin types were
included in the Salomon Brothers examination, none
of them gold, most of them subsidiary coinage (dimes,
quarters and half dollars), some of them minor coinage
(half cent through three cent nickel) and a couple
of silver dollars and commemoratives.
Gold was left out because it was felt by Salomon that
general gold coins would mirror the gold market (a
measured component) and be influenced by non-numismatic
events. Scott Travers advanced the same argument to
me a year or so ago and I spent a hundred hours or
more to try and prove him wrong - only to discover
the data does not lie; it might work with $3 gold
pieces, but generic Saints just parallel the gold
market.
Coins included in the market basket are each broadly
representative of a class of coins, or a type that
is widely collected and hence easy to value, even
if the individual coin date and condition is not easily
replicated. For example, an 1876 20-cent piece in
uncirculated condition is approximately the same as
an 1875 20-cent piece and even an 1875-S.
A 1795 Draped Bust dollar is similar to the 1796 or
even the 1797 or 1798 silver dollar (though clearly
not the 1794, in a class by itself - you'll have to
wait for the book to see that one).
Mintages and scarcity vary, but overall trends can
be followed with reasonable adjustments. The coins
were initially selected for Salomon Brothers by Stack's,
the well-known New York coin dealer, and were designed
so that if, for example, an 1873 two-cent piece in
proof is not seen on the auction market, or in over-the-counter
trading, then an 1871 or even an 1865 (with adjustments)
can be substituted to check on the appropriate price.
I understand why a market-basket approach was initially
taken. It was in a pre-computer age except in the
most technologically advanced offices. That's the
origin of the Dow, as well; 30 numbers and calculations
are easier than 1,200. For coins, 20 is easier than
2,500.
Tracking the coins on a computerized spreadsheet has
been done by me for many years. Besides the coins,
statistics include a total amount (aggregate) for
the coin portfolio and its annual average plus rate
of change from year to year, the average price of
gold and silver, the CPI and its rate of change, gold's
rate of change, the Dow Jones Industrial average and
its rate of change and the price of platinum.
All of them initially went back to 1947, then for
several years as I got more data, back to 1938 (except
for platinum, which I initially tracked back to 1978).
I recently found good data (government mining sources)
that allowed me to value platinum for charting purposes
back to the late 1930s. I expanded coin prices back
to 1935, when Numismatic Scrapbookbegan and when reliable
auction prices made it possible to test price levels.
Last year I added University of Iowa survey going
back more than 25 years on Iowa farmland, replacing
the prior U.S. Department of Agriculture statistics
for the value per acre of farmland. It appeared in
the old Salomon Brothers survey, too, using sporadic
interpretive data. With Prof. Duffy's help, I managed
to get solid data back to 1951 (annual) and then sporadic
data back to 1935 - again, fine for charting purposes.
The average per-acre price was an average of the federal
statistics, which actually do it for each of the 50
states and make it available through the USDA Economic
Research Service and National Agricultural Statistics
Service. The current figures quoted by me are Iowa
State University's agricultural extension program.
Two years ago, I added Moody's "Aaa" rated
corporate bonds as a point of comparison, picking
up the numbers from the Statistical Abstract of the
United States, a Census Bureau-Department of Commerce
publication. Updates on this were picked up off the
Internet. The Statistical Abstract in print runs a
little behind.
I took the time to count, and what all of this means
that the current spread sheet has over 4,100 data
entry points that analyze a variety of markets. For
convenience, this year, some of the charts cover only
the last quarter century, from 1979 to the present.
Standard & Poor's, which once started in 1957,
now goes back to 1935.
There are no secrets about this; when you chart gold,
there's not a lot of movement between 1934 and 1968
- a $35 an ounce rate was enforced by the government's
purchase and sale program and by a prohibition against
domestic private gold ownership. The charts are more
interesting when looked at over the last 35 or so
years when gold or platinum are involved.
Regardless, my index points utilize the same coins
that Salomon Brothers did from 1978 to 1990, and about
which I have written extensively over that period
of time. It also utilizes the same chart and target
points - though expanded - that I've utilized in more
than 40 years of writing about the rare coin market.
Prior to 1999,1 used a wide variety of independent
sources for the chart, checking my data against reliable
price guides. Since then, Dennis Baker of NumisMedia
has been kind enough to lend me the Fair Market Value
pricing for each of the coins. Dennis used to be the
editor of the Coin Dealer Newsletter. He struck out
on his own and NumisMedia offers a fine print as well
as a fine online pricing guide (www.NumisMedia.com).
Dennis actually does the pricing (I don't go to the
Web site - we do this by e-mail) at great cost of
time and effort, and he is truly my unsung hero. Without
his help, I could never find the time to do this column
even once a year, much less twice.
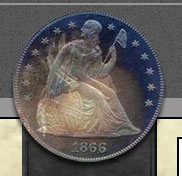
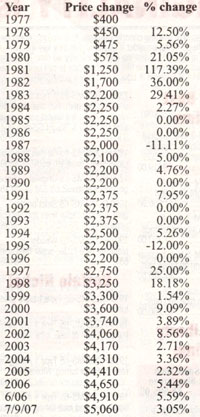
Here's an actual example of pricing for a particular
coin, the 1794 half cent in XF-40 condition, which
shows that rare coins go up, down and sideways - that
is, sometimes they don't change from year to year
at all. Even with no change, the overall picture over
a 68-year period shows an average annual return of
10.65 percent since 1935 - not bad for a circulated
coin with a mintage of over 81,000 pieces.
Take a look at the 1794 prices over the last 30 years
(from 1977):
Although
the listing of the components of the Salomon
Brothers market basket was never made public
by its purveyor (Stack's, the rare coin dealership
in New York which compiled it) or the source
(the investment banker, Salomon Brothers, which
was swallowed up by Smith Barney and Citibank
more than a decade ago), the list was disclosed
in the Neil S. Berman and Hans M.F. Schulman
book on coin investing that the Coin and Currency
Institute published in 1986.
Earlier this year, a newly revised edi¬tion
of the book was published by the Coin &
Currency Institute, and it is chock full of
data and statistics. The statistics in The Investor's
Guide to U.S. Coins includes research by Dr.
Jason Perry, a financial economist at the Federal
Reserve Bank of Boston.
The coins in the Salomon Brothers report and
the report itself (which was an annual event)
took on a life of their own and made an indelible
impression on the rare coin market from 1978
to 1990. It took over the glee with which the
Red Book's annual prices were given when they
arrived on bookshelves each July 1.
(Those collectors of a certain age remember
how important Red Book price changes were -
and the reliable way that, even now, old Red
Books have come to represent a historical point
in the marketplace).
Importance of the data was heightened when the
Federal Reserve Bank of Boston published extracts
in a famous 1978 publication that called stocks-
undervalued and drew attention to the rate of
return of rare corns and other tangible assets.
The
New England Economic Review, a publication of
the Federal Reserve Bank of Boston, made the
study the focus of an article in May 1979, entitled,
"Are Stocks a Bargain?" (It concluded
that stocks were well off their historical rate
of return and hence were a bargain that a serious
investor ought to consider.).
It was given more widespread industry credence
in 1982 when A Guide Book of United States Coins,
the Red Book, published an important essay that
discussed the survey and the market-basket approach
to valuing coins as an investment. I wrote that
essay, which dis¬seminated the information
to hundreds of thousands of people.
During its dozen-year run, the Salomon Brothers
report was used in a manner similar to the Dow
Jones Industrial Average to measure growth of
selected areas of rare coins; it was a market
basket, designed to measure trends, though incidentally
it showed how several defined areas of collecting
did.
I recall calendering each year to call Robert
Salomon to both get the data and to interview
him on its meaning. (The data was initially
disseminated only to clients of the white shoe
firm, but its media life ended up giving it
greater publicity and dissemination.)
One unfortunate aspect: trends from the report
were marketed by the unscrupulous. As the Federal
Trade Commission and the American Numismatic
Association warned in a joint brochure, "Dishonest
dealers often mislead buyers by quoting appreciation
rates for rare coins from an index formerly
compiled each year by Salomon Brothers, a New
York investment bank."
The brochure continues,
"These quotes show appreciation of 12 percent
to 25 percent a year. However, the Salomon index was
based on a list of 20 very rare coins, while the coins
sold by dishonest dealers are more common coins that
are not likely to appreciate at the same rate, if
at all."
The FTC and the ANA warned that "almost all dealers,
legitimate and dishonest alike, have used the Salomon
quotes. Therefore, it is particularly important that
you choose your dealer carefully. Remember, there
is no guarantee that any coin will appreciate in value.
"
Use of the quotations and the indices was necessary
because there was no other index done by any disinterested
third party who examined the coin market, and other
points of comparison. The Salomon study was looked
at, and eagerly awaited, for as a much as it told
about coins as a it did about stocks and other investment
vehicles.
After Salomon discontinued its index and annual comparison
- under pressure from the FTC - points of comparison
were left to universal indices or even specialized
comparisons that examined the market as a whole but
failed to show earlier periods. (I've done a column
on it in Numismatic News, at least annually since
then, but the Salomon Brothers version was more universal
in its appeal and coverage).
None of the 20 coins included in the market basket
are of gem quality - the word "gem" was
used then, but not as strictly as it is today - so
most of the coins included were choice uncirculated,
the equivalent of MS-63 on most of the numerical grading
scales that are now employed, though except for coppers,
it was not in widespread use during the Salomon era.
Comparison of one or more of the coins with the portfolio
as a whole affords an opportunity to compare not only
how rare coins compare with the consumer price index
and the Dow Jones Industrial Average, but other coins
as a well - and specific issues (like, say, an MS-63
half dollar of 1921 versus an XF half cent from 1794,
and the coin portfolio average as a whole).
By 1989, the results were impressive. As the survey
written by Salomon Brothers itself stated, "Conclusion
offered: during the preceding 12-month period of time,
rare coins offered a return of more than 30 percent,"
ranking behind only old masters' paintings and Chinese
ceramics. Stocks and bonds were seriously threatened.
The accompanying charts prepared by me utilize the
20 coins that are found in the Berman-Schulman list.
Some show only from 1979 (a conceit of time) and then
show the prices for them from 1935 to the present
expressed as a total portfolio. It also shows how
the Dow Jones has done - ups, downs and all - and
compares them.
If the market basket had been compiled in 1935, it
would have cost around $125 to assemble; by 1947,
it would have cost about $430 to build the collection.
Considering that lawyers were being paid $31 a week
to work on Wall Street that year, the sum was not
inconsequential.
Activity since 1970 of
farmland, gold, the coin portfolio average and
the individual 1873 two-cent piece are compared.
Fast forward
some additional years. In 1956, it went over
$1,000 for the first time ($1,003) to acquire
the portfolio. By 1961, it had increased to
$2,168; in 1964 it went over $4,453 - not surprising
considering the market was fueled for success.
By 1974, the number tripled to $13,040, amidst
Nixonian inflation.
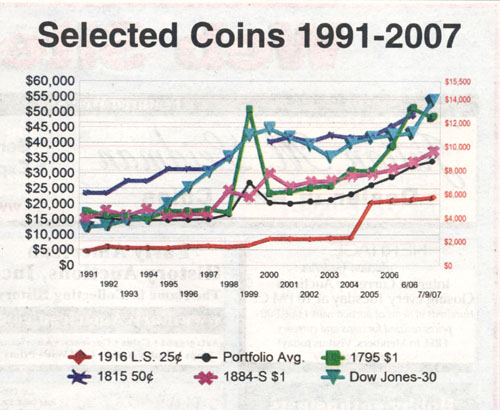
Shown from 1990 are movements of the coin
portfolio average, Dow Jones index, 1916 Standing
Liberty quarter, 1884-S dollar, 1815 half
dollar and 1795 dollar.
In 1985, a
decade afterwards, it weighed in at $54,800,
by 1997 it had increased to $74,810. The price
as of mid-2002 was $104,230 - an increase
of about 3.07 percent over the previous year.
By 2006, the value of the portfolio was $144,800.
It's now at around $170,000 and going strong.
While there's
no telling what tomorrow will bring, the charting
shows the clear past - and perhaps if trend
lines are followed, what the future might
bring