Rare
Coins: A Distinct and Attractive Asset Class By Robert A. Brown, Ph.D., CFA
Abstract
It has been suggested that the decade ahead may offer relatively
unattractive asset class returns for the most traditional
investment categories such as large-cap domestic equities.
The resulting debate has promoted interest in such less traditional
asset categories as venture capital, hedge funds, commodities,
timber, real estate, energy, works of art, and collectibles
on the part of both institutional and individual investors.
It is this last category of rare collectibles, specifically
coins, which I examine within this paper.
According to the Financial Times, over the past 50 years
art as an investment has shown returns in line with the S&P
500 Index, according to the Mei/Moses Fine Art Index, which
tracks 6,300 works sold at auction in New York. From 1954
to the end of 2003, art returned +12.6 percent, according
to Mei/Moses (versus +11.7 percent for the S&P 500).
Under this broader rare art and collectibles universe, similarly
attractive performance can be found in the rare-coin market,
which, excluding silver coins and bullion-based gold, exceeds
$40 billion. This paper offers an unbiased assessment of the
inherent, fundamental, and relatively permanent risk, return,
and diversification properties of the robust collectables
sub-segment called numismatics and is based on rare-coin pricing
data spanning a 62-year period.
The data accumulated, analyzed, and presented here suggests
a highly attractive complementary asset category that even
with a small allocation provides good diversification for
a well-diversified portfolio, and whose returns look impressive
when compared against the fixed-income category and as an
inflation hedge. In addition, capital and economic market
conditions suggest that rare coins could exhibit above-normal
returns compared with underperforming recent years.
Allocation of a portion of an individual's portfolio to rare
coins must be pursued with full appreciation for the non-income
generating nature of this asset category and recognition that
no profit-generating corporate entity stands behind it. Moreover,
rare coins exhibit a relative lack of liquidity and potentially
high transaction costs.
With the failure of the S&P 500 to reach lows that would
have brought the majority of fundamental valuation measures
back to their historic norms, many of our industry's more
serious thinkers, those with real gravitas, have suggested
that we'll experience long-term investment challenges ahead.
Investment luminaries such as Robert Arnott (editor, Financial
Analysts Journal, Peter Bernstein (consulting editor, Journal
of Portfolio Management), Bill Gross (PIMCO), John Templeton
(Franklin/Templeton), Bill Bonner (The Daily Reckoning), Jim
Grant (Grant's Interest Rate Observer), Jeremy Grantham (GMO),
and Stephen Roach (Morgan Stanley) have suggested over the
last two years that the decade ahead may offer relatively
unattractive, if not painful, asset class returns for the
most traditional and vanilla investment categories such as
large-cap domestic equities. The resulting industry-wide debate
has prompted a serious reexamination of less traditional asset
categories such as venture capital (and its associated neighbors
and offspring within the private investment arena), hedge
funds, commodities, timber, real estate, energy, and rare
art or collectables. It is this last category of rare collectibles
that I examine within this paper—focusing specifically
on the subcategory of rare coins or numismatics.
Stephen Roach, among others, believes that domestic stocks,
bonds, and residential real estate are simultaneously and
significantly over-valued as a result of excess liquidity
having been pumped into our economy through actions by the
U.S. Federal Reserve and by the monetary, savings, and investment
behaviors of foreign nations. If true, as financial planners
we have the responsibility to seek less traditional asset
categories that remain predominantly unaffected by today's
extreme overabundance of liquidity.
Rare coins is one such nontraditional asset category. But
why consider rare coins as a viable component of your client's
total wealth management solution? As will be demonstrated
below, rare coins have historically offered fairly consistent
and attractive levels of return, risk, and diversification.
Over the last 62 years, this asset category has delivered
an arithmetic mean annual return (before inflation) of 10.5
percent with a relatively low standard deviation of 12.3 percent.
But the real benefit derived from this asset category lies
in its diversification power. Some of its best relative performance
is delivered during those periods when long-term bonds perform
particularly poorly.
Moreover, it is not uncommon for high net worth clients to
already be comfortable with and have significant holdings
in the rare art or rare coin markets. Nevertheless, investment
in the asset category of rare coins entails a series of distinct
challenges. These potential impediments include transaction
costs (bid/ask spread), transaction time, specialized knowledge,
proven investment properties, market depth, lack of dividend
or interest income, and recognition that no profit-generating
corporate entity underlies the asset category.
Clearly, rare coins are a highly distinct asset category,
offering a remarkably different set of investment characteristics
and properties. But the impediments recognized in the preceding
paragraph must be overcome. Much as with physical real estate
(so-called "bricks and mortar"), the sale and purchase
of rare coins entails incurring a measurable bid/ask spread.
This obstacle is significant, but with reduced trading, investors
can satisfactorily overcome turnover through the attractive
long-term fundamental returns accruing to this asset category.
Once again, just like physical real estate, participants in
the rare coin market should allow significant time to complete
acquisitions or sales. Nevertheless, the speed with which
coin prices evolve is sufficiently slow and gradual to accommodate
the more extended time required for transactions.
Finally, just as with physical real estate, specialized knowledge
is well developed and readily available at a reasonable cost
and is delivered by a wide range of professional dealers in
the marketplace. The challenge of verification is no longer
an issue, as all investment quality coins are authenticated
and encapsulated by two primary service bureaus: Professional
Coin Grading Service and Numismatic Guaranty Corporation of
America. Valuation is well handled by the ready availability
of recent transaction prices (providing investors with accurate
bid/ask spreads) and through the advice of professional dealers—much
as is the case with the private real estate market. Safekeeping
(storage and insurance), however, remains an ongoing expense—once
again, not dissimilar from bricks-and-mortar real estate.
The last two potential impediments—proven investment
properties and market depth, are the primary subjects of this
article. As described below, returns in both an absolute standalone
basis and, more importantly, in a well-diversified portfolio
context, have been highly attractive over the last 62 years.
Similarly, the market for rare coins is deep, well developed,
and improving.
Art and Collectibles Universe
I begin my examination of rare coins with a quick high-level
review of the far broader rare art and collectibles universe.
If the investment merits of rare coins are real and substantive,
then we would expect to find equally attractive performance
within the more broadly defined arena of art and collectibles.
As reported in the January 27, 2004, London Financial Times,
the Artprice Global Index rose 1.5 percent in 2003. This index
includes the prices of 30,000 works of art sold at 2,900 auction
houses around the world in 2003 and is considered to be a
reasonable measure of the state of the aggregate global high-end
collectables marketplace. In 2004, the Artprice Global Index
rose 24.4 percent. Another index, the Mei/Moses Fine Art Index—All
Art, showed gains of 21.7 percent and 13 percent in 2003 and
2004, respectively. Over the last 50 years (1955–2004,
inclusive) this index appreciated 10.5 percent annually versus
10.9 percent for the S&P 500, 6.6 percent for 10-year
U.S. Treasury bonds, and 5.4 percent for short-term U.S. Treasury
bills. This index is noteworthy because it tracks over 8,000
works sold at auction and is therefore based on real-time
investor-realized pricing. Fernwood Art Investments LLC, a
New York-based company, founded recently by former Merrill
Lynch & Co. Inc. veteran Bruce Taub, began offering art-based
funds in early 2005 as an alternative asset class. Funds and
investment partnerships are being formed to offer shared interests
in portfolios of paintings by old masters, impressionists,
and others. Fernwood states "Art is like what real estate
was 30 years ago, it's ripe for investment."
Rare collectibles as an investment and as a personal pursuit
have been with us for centuries. But one of the oldest and
most well-developed segments of the collectables asset category
is that of numismatics or rare coins. In 1912, the U.S. Congress
created the American Numismatic Association (ANA) to promote
popular interest in the study of numismatics.1 Barry S. Stuppler,
a member of the ANA's nine-person board of governors, estimates
that the total rare coin market experienced domestic sales
approximating $2 billion in 2003. Moreover, he estimates that
the total supply (market value) of domestic rare coins is
in the neighborhood of $40 billion (and this figure does not
include bullion-based gold and silver coins that would bring
the total market value up considerably).
The depth, vitality, and consistency of the numismatic marketplace
are exemplified by numerous anecdotes.
In February 1989, Kidder Peabody launched a $40 million
rare coin investment fund, later increased to $110 million,
named the American Rare Coin Fund.
A year later, in February 1990, Merrill Lynch underwrote
a $50 million fund called the NFA World Coin Fund Limited
Partnership. United Bank of Switzerland (UBS) maintains
a separate and independent division, UBS Gold & Numismatics,
designed to provide an ultra high level of professional
advice by experienced experts in the field of numismatics
to its private client base.
In a July 2002 Sothebys/Stack's auction a 1933 $20 double-eagle
gold piece sold for $7,590,020. In 1960, this same piece
traded for $25,000—a 14.6 percent annual rate of return
over 42 years.
In an August 1999 Bowers & Merena auction, an 1804
proof silver dollar sold for $4,140,000. In 1960, this same
piece traded for $30,000—representing a 13.5 percent
annual rate of return over 39 years.
In an early 2004 Blanchard and Company auction, a 1913
Liberty nickel sold for $3 million. In 1960, this same piece
traded for $50,000—a 9.8 percent annual rate of return
over 44 years.
Finally, in a May 1999 Goldberg Coins auction, a 1907
ultra high-relief $20 double-eagle gold piece sold for $1,210,000.
In 1960, this same piece traded for $20,000—an 11.1
percent annual rate of return over 39 years.
It should be emphasized that the returns stated above are
gross of appraisal, insurance, storage, and other transactions
costs (similar to but higher than what one would experience
in the private real estate industry).
In the context of these examples and data, this paper's objective
is to offer an unbiased assessment of the inherent, fundamental,
and relatively permanent risk, return, and diversification
properties of the robust collectables sub-segment called numismatics.
Methodology
Rare coins may be stratified along numerous dimensions; however,
one convenient classification divides the universe by metal
type: copper, silver, gold, and other precious metals. The
behavior of the precious metals (gold, platinum, and palladium)
spot and futures markets has significantly affected the return
behavior of rare gold coins during periods of extreme precious
metals price volatility. So as not to confuse and otherwise
intermix the behavior of precious metals and numismatics,
I have excluded gold and other precious metals (platinum and
palladium) coins from this paper's analysis. Moreover, for
consistency and reliability I have restricted the analysis
to U.S. coins and pricing data has been drawn exclusively
from domestic sources.
All rare coin pricing data was provided by the following
two sources: Handbook of United States Coins with Premium
List (the Blue Book) for the annual copyrights 1942 through
1951, and A Guide Book Of United States Coins (Red Book) for
1950 through 2004.2
Coin-price data provided from these publications was used
to build unique equal-weighted (by dollar value invested)
portfolios of coins for each individual year. These portfolios
were then tracked to the subsequent year and an annual return
was calculated. The composition of each year's portfolio was
uniquely tailored in order to most evenly distribute holdings
across the entire available domestic universe at that time.
Selections were evenly spread across all copper-based and
silver-based U.S. coins. For publication copyrights 1942–1960,
portfolios consisted of 600 individual coins. For copyrights
1960–present, portfolios consisted of 650 unique rare
coins. The higher 650-coin count was used during the later
years with the objective of better representing the breadth
and depth of the more modern rare coin market relative to
the somewhat narrower pre-1960 marketplace.
Minimum coin condition was generally held to the highest
available as reported in the then-current Whitman publications.
In the initial years, such as 1942, "fine" was the
minimum condition included within the 600-coin portfolios.
The maximum condition (MS-65) appearing across all portfolios
was similarly defined by the reporting limits of the Whitman
publications.
As an example, a portfolio of 650 copper and silver coins
was created and based on the pricing appearing in the 2004
edition of A Guide Book of United States Coins. Coins were
selected with the objective of evenly dispersing the holdings
across the entire available universe as reported in the 2004
Red Book. Portfolio holdings were equally weighted (by dollar
amount invested in each coin). The 2005 edition was used to
reprice the original portfolio and determine an annual rate
of return, (+16.39 percent in this instance.)
A Critical Question
A critical question concerns the exact start and end dates
for the annual 12-month investment windows. For example, the
2004 edition has a 2003 copyright and was first released to
the public in late July 2003. The start date for the subsequent
12-month investment window depends on when the coin price
data was collected for this publication. This paper's analysis
is based on a specific estimate for each annual return's inception
date. The following methodology was employed to make this
estimate.
A series of 62 annual returns were calculated based on the
Blue Books and Red Books spanning 1942 through 2004. This
series was compared against annual returns for 13 other unique
and fully differentiated asset classes (spanning both fixed-income
and equities). The annual rare coin return series was next
shifted one month at a time, both forward and backward. This
generated a series of 31 alternate comparisons (that is, no
time shift, 1-month through 15 months shifted backward, and
1-month through 15-months shifted forward). An evaluation
was completed for each of these 31 return series. Specifically,
I calculated the correlation coefficients between the rare
coin series and each of the 13 other asset categories. A median
correlation (across the 13 alternate asset categories) was
identified for each of these comparisons. I then identified
the single rare coin time series (from among the 31 alternate
shifted series) that delivered the highest median correlation
coefficient. The answer turned out to be the rare coin series
that had its series shifted backward in time by one month.
In other words, I found that by assuming that pricing data
taken from the 2004 edition of the Red Book with copyright
2003 was actually obtained from the marketplace on November
30, 2002, then the correlation coefficients with 13 other
common asset categories were maximized. This result, in effect,
amounts to a shift backward in time by one month (that is,
from December 31, 2002 back to November 30, 2002).
Underlying this methodology are the following premises. First,
coin prices appearing in a 1990 edition with copyright dated
1989 will have been collected either very early in 1989 or
sometime in late 1988. Second, asset classes have a strong
and fundamental tendency to move in tandem with the passage
of significant time. Thus, they generate positive correlation
coefficients. Third, the most realistic assessment as to the
time positioning of the annual rare coin series can be determined
by positioning the annual window so as to achieve a maximum
median correlation coefficient. The statistical result identifying
an initial start date of November 30th of the year preceding
the annual copyright date is intuitively appealing. It suggests
that the data reflected in the 1990 edition with copyright
1989 was current and immediate in the rare coin marketplace
as of November 30, 1988. The November 30, 1988, date is also
logically consistent with the public availability of the final
publication—that is, on or about July 31, 1989. This
would allow approximately eight months to collect the rare
coin data, interpret it, update the guidebooks, send them
for printing, and distribute them to retailers for public
sale.
Results
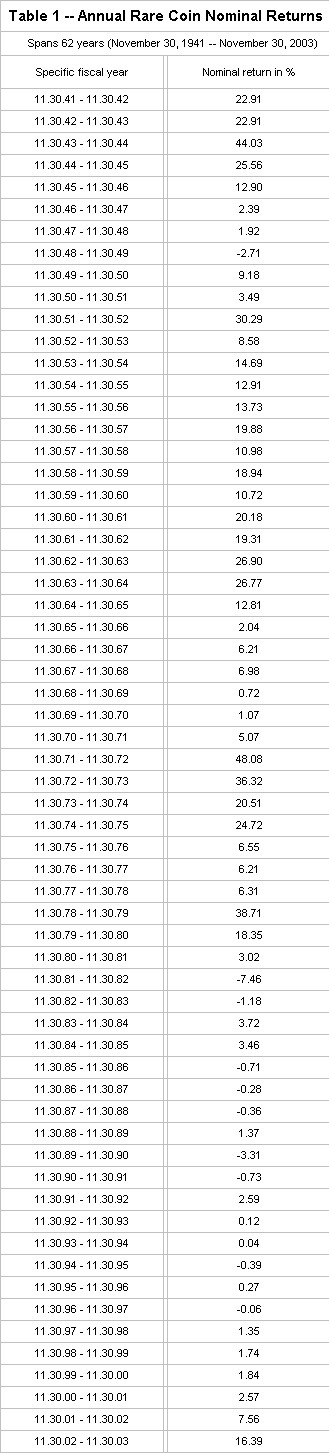
Table 1 provides this paper's estimates for rare coins' annual
returns spanning the period November 30, 1941, through November
30, 2003. Returns ranged from a low of –7.46 percent
(1981/1982) to a high of +48.08 percent (1971/1972), with
a median annual return equal to +6.26 percent. During the
last 62 years, rare coins delivered a positive return 84 percent
of the time (52 of 62 years as based on annual returns) and
an annual return greater than 10 percent 40 percent of the
time (25 of the years from 1941 through 2003, inclusive).
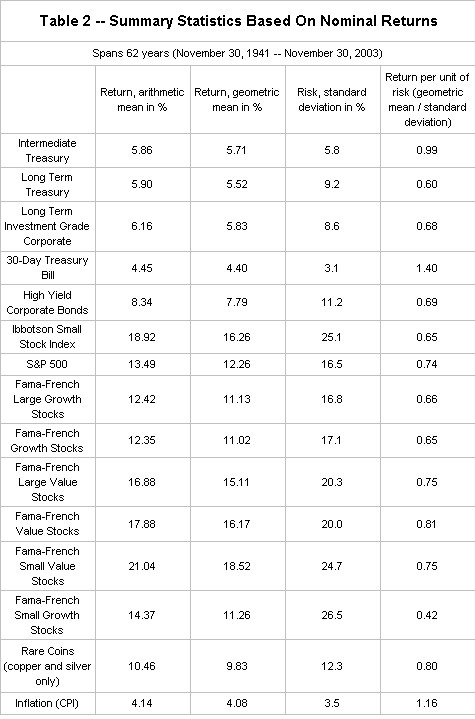
Table 2 provides the nominal (not inflation-adjusted)
summary statistics for this series. Relative to 13 other popular
asset categories, rare coins appear to offer relatively higher
average annual returns with commensurate to moderate levels
of return volatility. Over the last 62 years, rare coins offered
an average annual arithmetic mean return of 10.46 percent
and an average annual geometric mean return of 9.83 percent,
with a standard deviation of 12.3 percent. This compares quite
favorably against growth stocks over this same 62-year period,
which delivered average annual arithmetic and geometric returns
of 12.35 percent and 11.02 percent, but with a significantly
higher standard deviation of 17.1 percent.
It should be noted that Table 2 reports on all
total return series for which monthly return data is available
spanning the entire time period indicated (November 30, 1941,
through November 30, 2003). Data for asset classes other than
rare coins were taken from the Ibbotson Associates databases.
Standard deviations were calculated on annual returns with
years starting and ending on November 30 as described in the
data methodology in preceding sections of this article. It
is believed that the standard deviations are directly comparable
across all of the asset classes appearing in Table 2, including
rare coins, because each return series is based on actual
transaction data as opposed to valuation estimates (as frequently
occurs with private real estate).
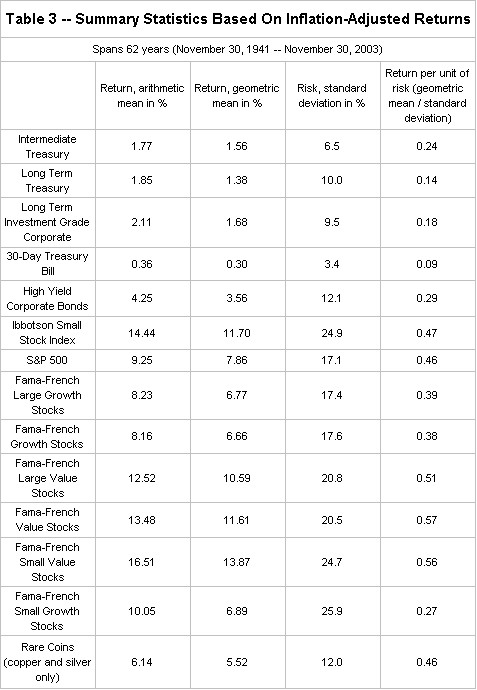
Table 3 provides the same statistics but in
real (fully inflation-adjusted) terms. A relevant observation
for rare coins is highlighted through a comparison of Tables
2 and 3. Observe how, after adjustment for inflation, rare
coins' return-per-unit-of-risk declines from 0.80x to 0.46x.
Yet, intermediate U.S. Treasury bond's return-per-unit-of-risk
declines by a far greater amount, falling from 0.99x to 0.24x.
This difference is a result of rare coins' propensity to deliver
a degree of protection during inflationary environments. This
observation is supported by the clearly superior correlation
coefficient between coins and inflation (0.12) relative to
the correlation coefficient between the S&P 500 and inflation
(–0.31).
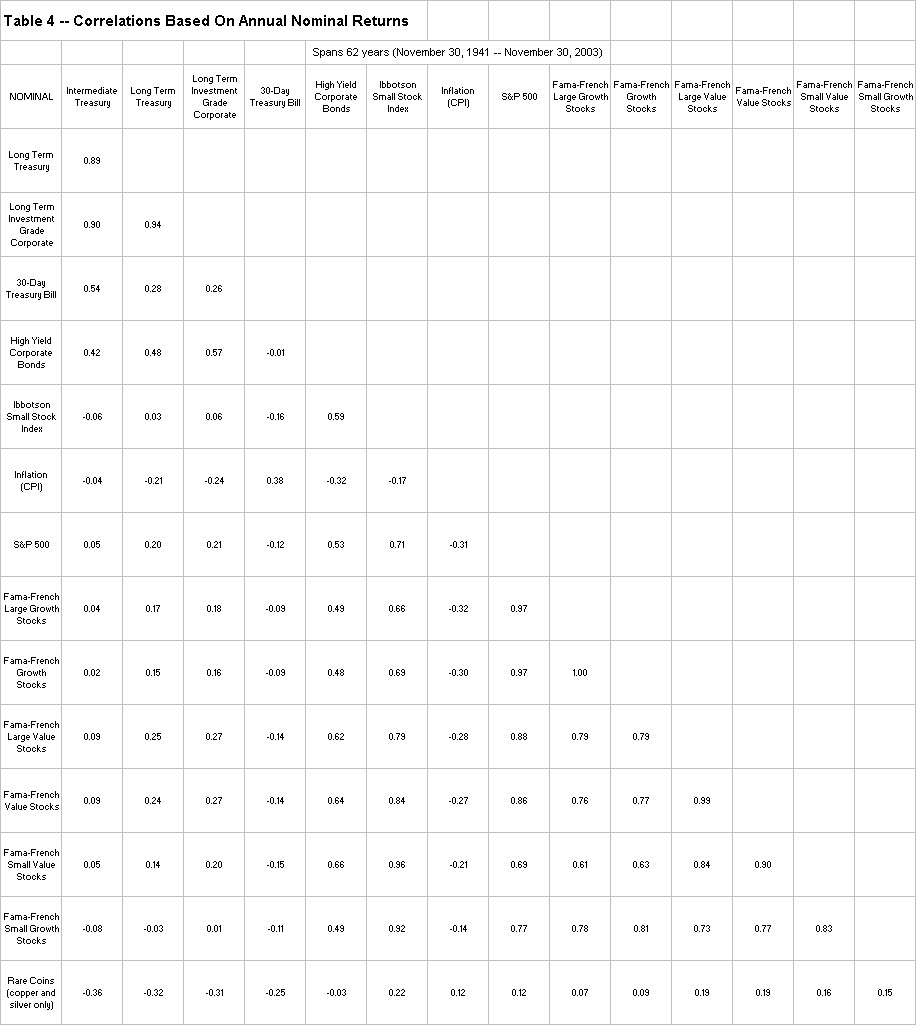
Table 4 reports the correlation coefficients
between rare coins and each of the 13 primary asset categories
(plus CPI inflation) based on nominal returns (non-inflation
adjusted). Rare-coin correlations with equities tend to be
higher than with fixed income due to fixed income's poor performance
during periods of rising inflationary expectations. Note rare
coin's correlations of 0.12 and –0.36 with the S&P
500 Index and intermediate U.S. Treasury bonds, respectively,
offering powerful diversification potentials.
More Powerful Diversification
Role
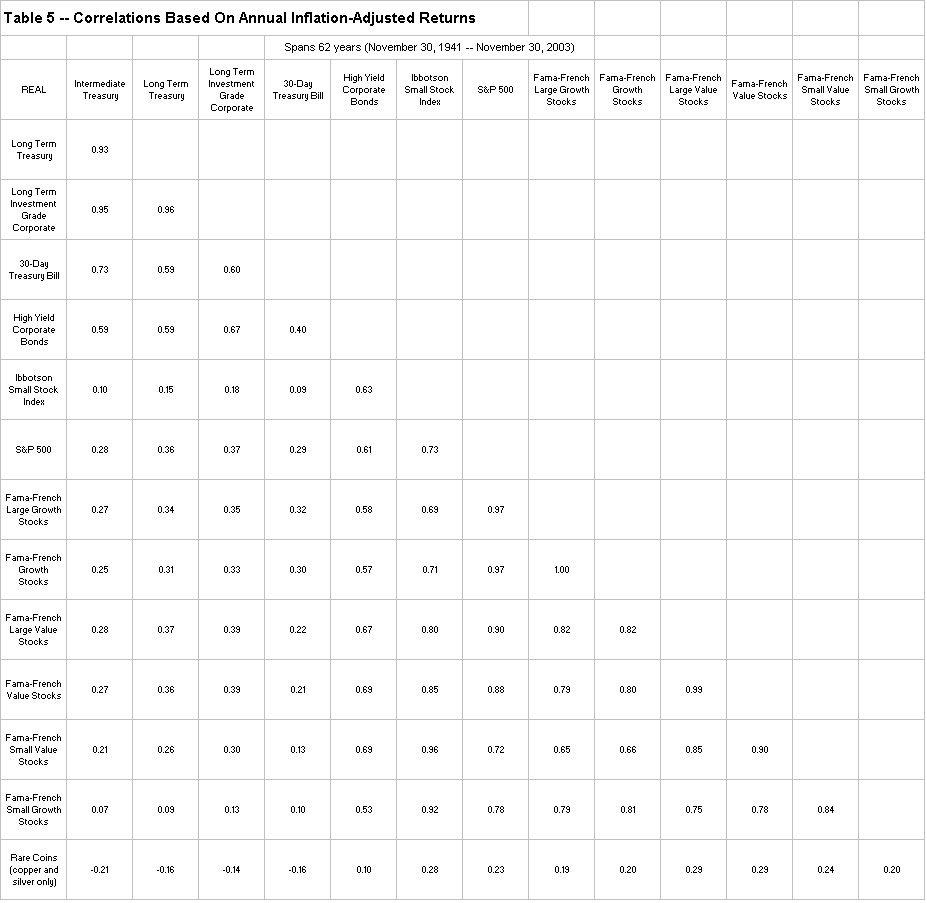
Using real returns (after adjustment for consumer price inflation),
we obtain the correlation coefficients appearing in Table
5. Comparing data appearing in Tables 4 and 5, we note that
correlations increase significantly across all asset categories
moving from Table 4 to Table 5. But the correlations for rare
coins increase less than any of the other asset categories
(that is, rare coins' average increase amounts to a lesser
+0.112 versus the other 13 asset categories average +0.153
increase). This smaller change results from coins' superior
behavior during inflationary environments and allows numismatic
investments to potentially play a more powerful diversification
role within a portfolio.
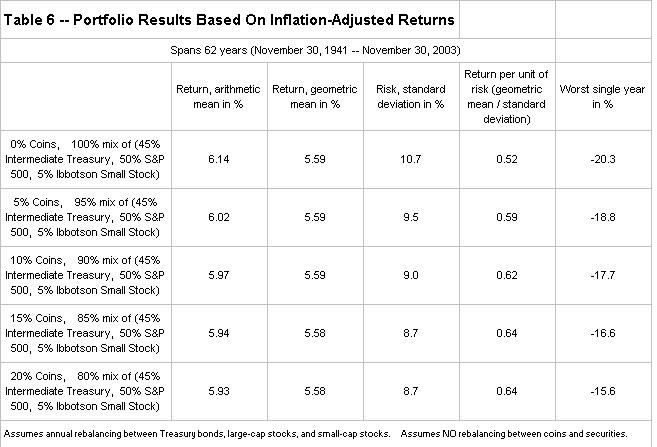
The practical benefits or attraction of rare
coins as an asset category are best demonstrated by examining
the cross-time performance characteristics of portfolios with
and without their inclusion. The bid/ask spread associated
with buying and/or selling numismatic coins tends to be quite
high. In a cross-time portfolio context, this has an important
practical implication; specifically, regular periodic rebalancing
of one's allocations to coins in a portfolio is impractical.
Table 6 provides a historical view of portfolio performance
with and without the inclusion of rare coins. But this data
assumes an initial allocation to coins of 0 percent, 5 percent,
10 percent, 15 percent, and 20 percent, with no rebalancing
during the 62 years covered by the analysis. By avoiding periodic
rebalancing, this paper delivers a more realistic view of
how investors actually construct and maintain exposure to
this attractive asset category.
Notice how a portfolio with an initial 15 percent allocation
to rare coins delivers a geometric mean return 1 basis point
lower than that same portfolio with a 0 percent allocation
to coins. But the standard deviation falls from 10.7 percent
to 8.7 percent after the inclusion of rare coins, and the
worst single annual return improves from –20.3 percent
(without rare coins) to –16.6 percent (after inclusion
of rare coins)
But no asset category should be evaluated solely
on the basis of simple summary statistics spanning some long-term
time period. Asset categories have a propensity to deliver
performance attuned to the current-period capital market and
economic environments in which they operate. During the 18-year
period ending November 30, 1999, for example, rare coins returned
an unattractive 0.0 percent a year.
The causality underlying this painful time period is not
difficult to identify. First, during the prior 18-year time
period (1963–1981) coins returned +14.2 percent annually,
generating a level of over-excitement that probably drove
rare coin prices to a transitory level from which prices needed
to fall back. Second, during the nine years ending November
30, 1999, the S&P 500 returned +21.01 percent a year.
This abnormally high stock market return spanning an unusually
long time period had the effect of pulling assets either out
of or away from investment in numismatic coins. Third, inflation
(as measured by the CPI) was running at a rate of +12.74 percent
for the year ending November 1979. Just seven years later,
this same inflation rate had fallen to +1.29 percent (year
ending November 1986). This remarkable fall in the rate of
inflation removed a key motivational factor that had previously
been driving coin prices during the 18-year period ending
November 30, 1999.
Improving Coin Environment
Today it would appear that the environment is changing. Capital
market and economic dynamics are potentially evolving in directions
that will result in below-average stock market returns while
at the same time delivering a period of rising inflation.
If we experience such a capital market environment, rare coin
investments may deliver above-average returns.
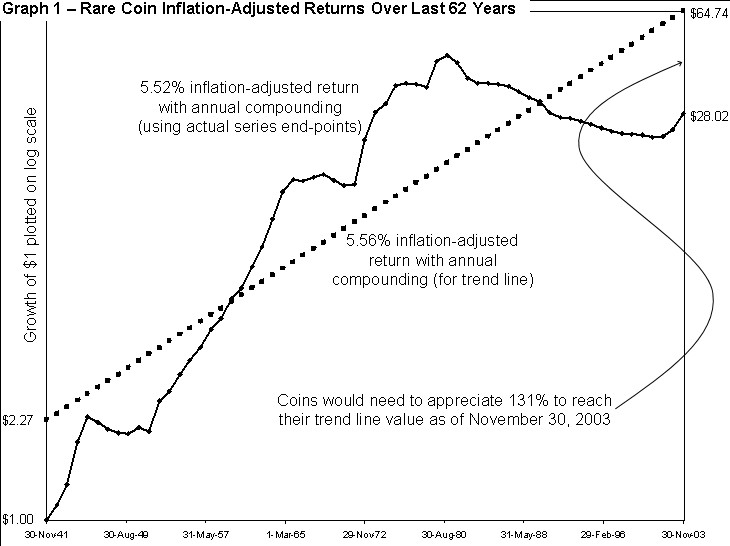
Graph 1 provides a historical cross-time view of the path
followed by inflation-adjusted rare coin prices since 1941
plotted on exponential scale (natural log scale). By using
an exponential scale, equal vertical distances correspond
to identical percentage rates of return independent of the
current absolute level of coin prices. The solid line identifies
the growth of one dollar invested in numismatic coins over
the 62-year time period. This line shows an average annual
inflation-adjusted geometric mean return of 5.5 percent. The
dashed line shows the constant rate of return path determined
by applying a best-fit analysis. This second, perhaps more
realistic, characterization of history shows an average annual
geometric inflation-adjusted return of 5.6 percent for numismatic
investments.
Since 1941, rare coin returns have followed a reasonably
constant return path—exhibiting occasional periods of
out- and under-performance. But as of November 30, 2003, rare
coin prices stood 131 percent below their trend line path.
This level of below-path pricing is most likely a function
of the recent below-normal return experience being driven
by low inflation in combination with considerably above-normal
stock market returns. Of special note, coin returns began
a marked turnaround starting November 30 2001 having risen
a total of +25.2 percent (unannualized) since that date.
A different method for exploring the environment-dependent
nature of rare coin returns is demonstrated by comparing fixed-income
portfolios constructed with and without numismatic investments.
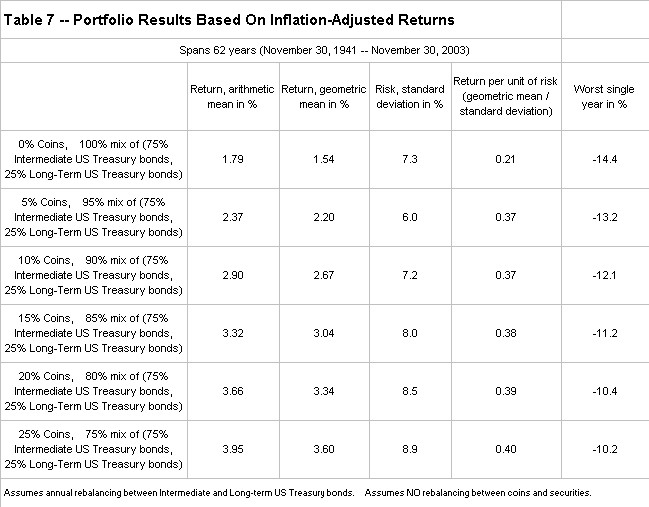
Table 7 shows the 62-year summary statistics for these alternate
fixed-income portfolios in real terms (that is, after adjustment
for CPI inflation.) By making these comparisons after inflation
adjustment, we are able to emphasize how relatively small
allocations to rare coins can deliver radical improvements
to a fixed-income portfolio's inflation-fighting performance.
Table 7 presents a series of six portfolios with initial
allocations to numismatic investments of 0 percent, 5 percent,
10 percent, 15 percent, 20 percent, and 25 percent. As before,
the allocations between rare coins and the other asset categories
are not rebalanced with the passage of time. The fixed-income
portion of these six portfolios consists of a mixture of long-
and intermediate-term U.S. Treasury bonds which are rebalanced
once each year to maintain a constant-percentage allocation.
The fixed-income portfolio without numismatic investments
experiences a standard deviation of 7.3 percent. The same
portfolio with an initial 10 percent allocation to rare coins
delivers a lower standard deviation of 7.2 percent and a higher
geometric mean return of 2.67 percent (versus 1.54 percent
without coins). Similarly, note how the bond portfolio without
rare coins suffers a worst single year of –14.4 percent.
In contrast, the bond portfolio with an initial 25 percent
allocation to numismatics experiences a far less severe worst
single year performance of –10.2 percent. These data
suggest that investors seeking the most conservative portfolios
(that is, bond portfolios) may be better served by incorporating
small allocations to numismatic investments as a method to
significantly enhance the inflation-protection characteristics
of their otherwise attractive fixed-income securities.
Investability
Three issues generally define the question of just how viable
rare coins or numismatics are as an investable asset category
for small portfolio allocations. These three factors are the
bid/ask spread, liquidity, and asset class-specific expertise.
Bid/ask spreads in the rare coin arena are consistent with
those found in other sub-segments of the rare art/collectables
marketplace. At the high end, bid/ask spreads can approach
40 percent. But the rapid growth of both the electronic and
physical auction market and the robust development of authentication
and grading of rare coins are serving to reduce these spreads
across the numismatic spectrum. The best-developed, commonly
traded, and standardized (through third-party authentication)
coins may trade at bid/ask spreads approaching 10 percent.
Liquidity concerns the time it takes to execute a transaction,
whether a buy or a sell. It also affects the size of the transaction
and indirectly the bid/ask spread that is paid. In the field
of numismatics, the transaction time period is properly measured
in months as opposed to minutes or hours, such as one would
find in trading large-capitalization shares on the New York
Stock Exchange.
In general, the rare-art marketplace requires significant
knowledge, experience, current information, and close contacts
with key participants to be fruitfully exploited from an investment
standpoint. The field of numismatics is no different. But
one of the reasons that a bid/ask spread exists is to compensate
the rare-coin dealer for the advice and consultation he or
she provides. Yes, part of the bid/ask spread is compensation
for performing the function of, in effect, marketmaker. But
in today's numismatic market, there exists a wide cross section
of highly professional coin dealers who view their buyers
as long-lived, permanent clients for whom they deliver expert
advice and consultation on how best to assemble a portfolio
of numismatic items designed to achieve a long-range objective.
Such dealers have intimate knowledge of markets and the longevity
of participation to properly assess the current environment.
So as with many other investment asset categories such as
venture capital, buyout, hedge funds, and real estate, one
pays for the required (and desired) expertise via the direct
or indirect bid/ask spreads reflected in the investment vehicle.
Rare coins are no different.
Conclusions
As ANA's governor Barry S. Stuppler has suggested, the marketplace
for numismatics is both broad and deep, having now reached
an aggregate market value in the vicinity of $40 billion (and
this figure does not include bullion-based gold and silver
coins that would bring the total market value up considerably).
It is an active market where single isolated auctions can
experience transaction volume over $30 million. Professionalism
and initial efforts towards institutionalization have been
demonstrated by numismatic investment funds launched by Kidder
Peabody and Merrill Lynch and by United Bank of Switzerland's
UBS Gold & Numismatics professional consulting division.
Pricing data drawn from the last 62 years of history (1941–2003)
suggest an attractive and potentially highly complementary
asset category—particularly relative to fixed-income
securities and as an offset to inflation. Over this period,
rare coins, the S&P 500, and long-term U.S. Treasury bonds
have delivered geometric mean returns of 5.52 percent, 7.86
percent, and 1.38 percent, respectively, after adjustment
for inflation. But after reflecting their differential standard
deviations, we find that rare coins, the S&P 500, and
long-term U.S. Treasury bonds have delivered return-per-unit-of-risk
of 0.46x, 0.46x, and 0.18x, respectively after inflation adjustment.
Rare coins' greatest benefit may be one of diversification.
The S&P 500 typically correlates with other common asset
categories at a level of between 0.28 and 0.97 (inflation
adjusted). In contrast, numismatic investments have delivered
correlations across similar asset categories ranging from
a far lower –0.21 to 0.29.
Robert A. Brown, Ph.D., CFA serves as Chairman-Investment
Management Executive Committee and Chief Investment Officer
for GE Private Asset Management, Inc., located in Encino,
California.
Endnotes 1. The American Numismatic Association (ANA)
maintains the distinction of being one of the very few organizations
in the United States to operate under a charter. The purpose
of the organization, as stated in its federal charter, is
to advance and promote the study of coins, paper money, tokens,
medals, and related numismatic items as a means of recording
world history, art, economic development and social changes,
and to promote greater popular interest in the field of numismatics.
On April 10, 1962, the Congress passed a second act making
the ANA a permanent and perpetual nonprofit, educational organization.
Today, the ANA maintains a library with more than 50,000 reference
materials available for loan to members free of charge.
Handbook of United States Coins with Premium List was written
by R.S. Yeoman, Lee F. Hewitt, and Charles E. Green. A Guide
Book of United States Coins was written by R.S. Yeoman and
edited by Kenneth Bressett. Whitman Publishing, LLC of Atlanta,
Georgia, produces both of these publications. The Handbook
of United States Coins focuses more on wholesale prices. A
Guide Book of United States Coins focuses primarily on retail
pricing.